IKKARI PFS: COMPELLING PROJECT ECONOMICS WITH LEVERAGE TO HIGHER GOLD PRICES
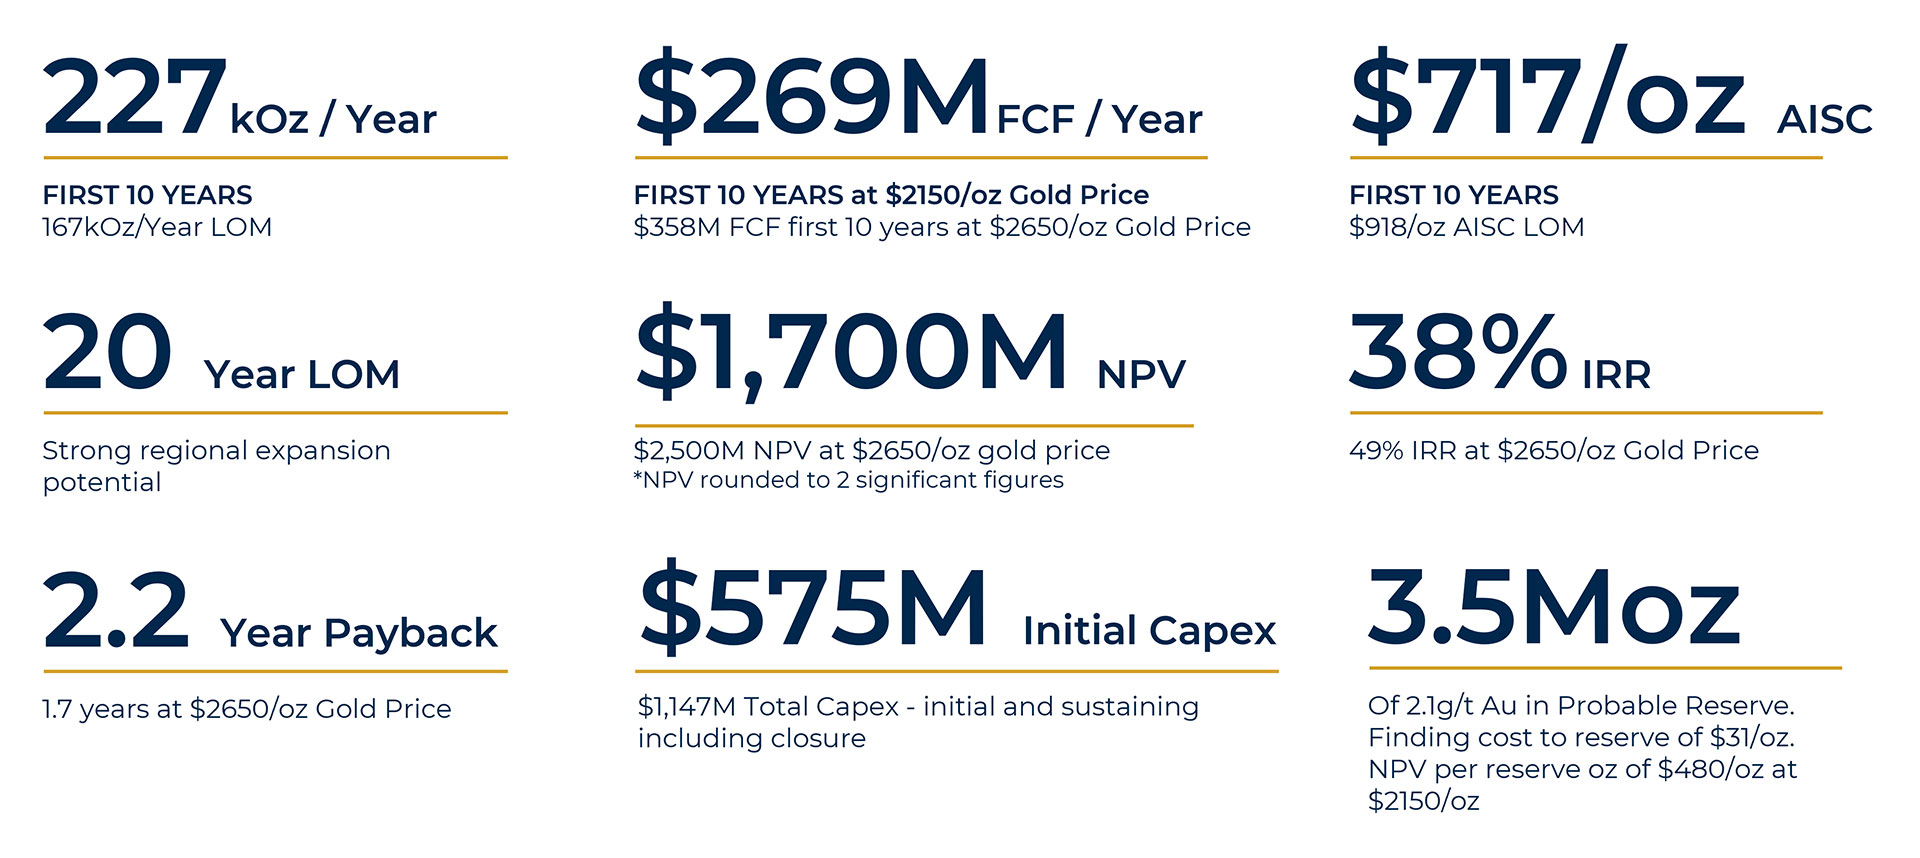
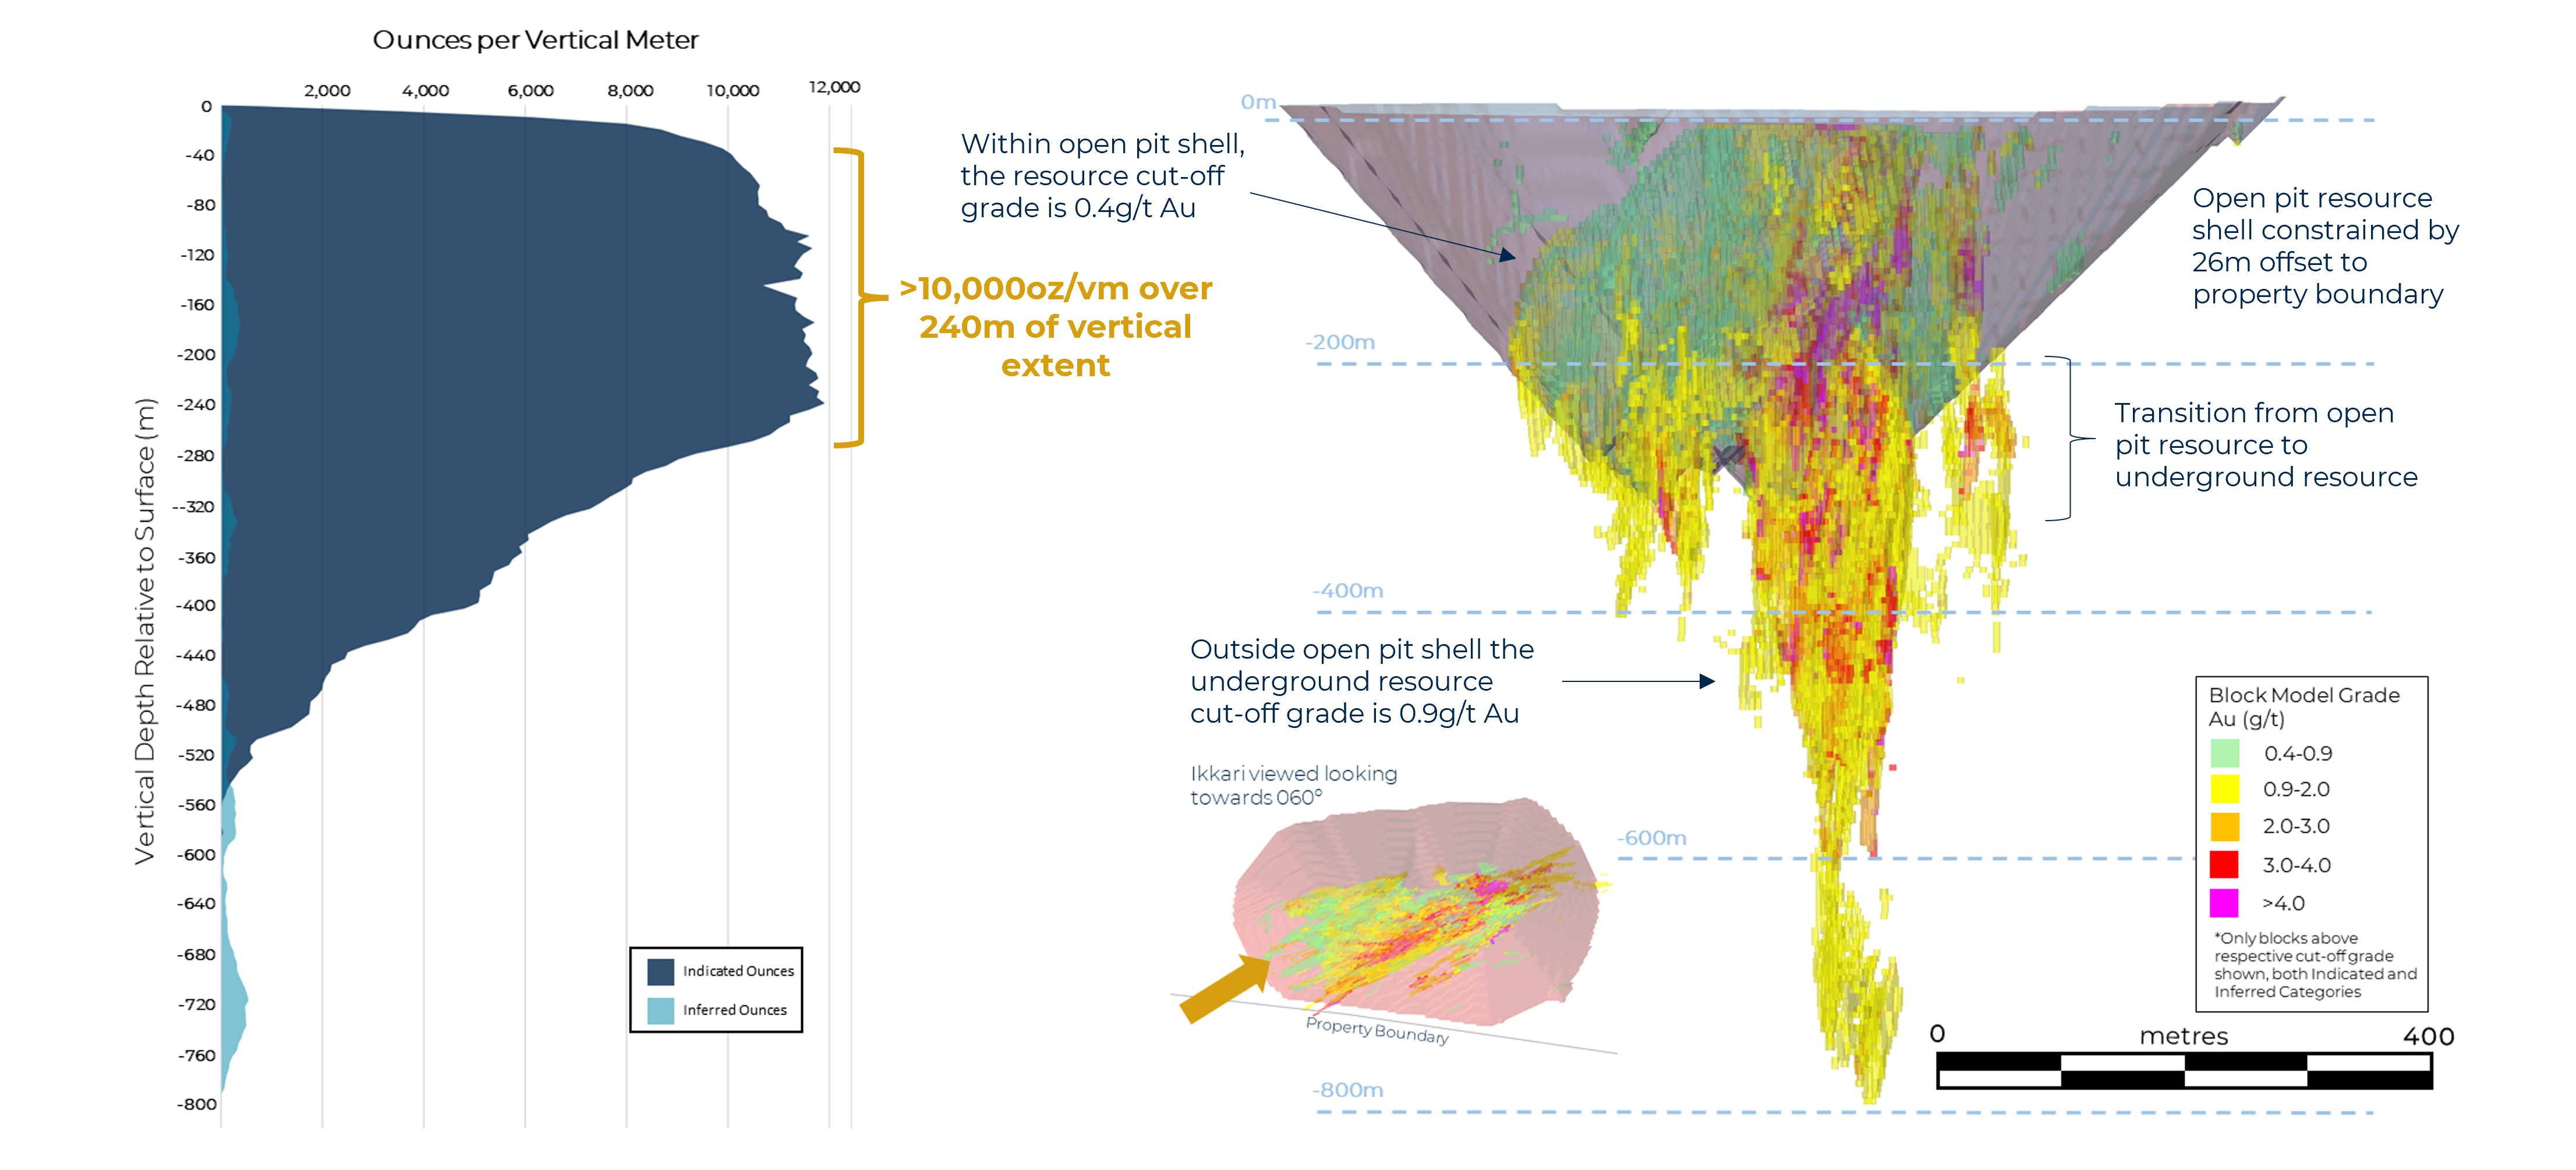
Probable Mineral Reserve of 52Mt at 2.1g/t Au for 3.5Moz Au
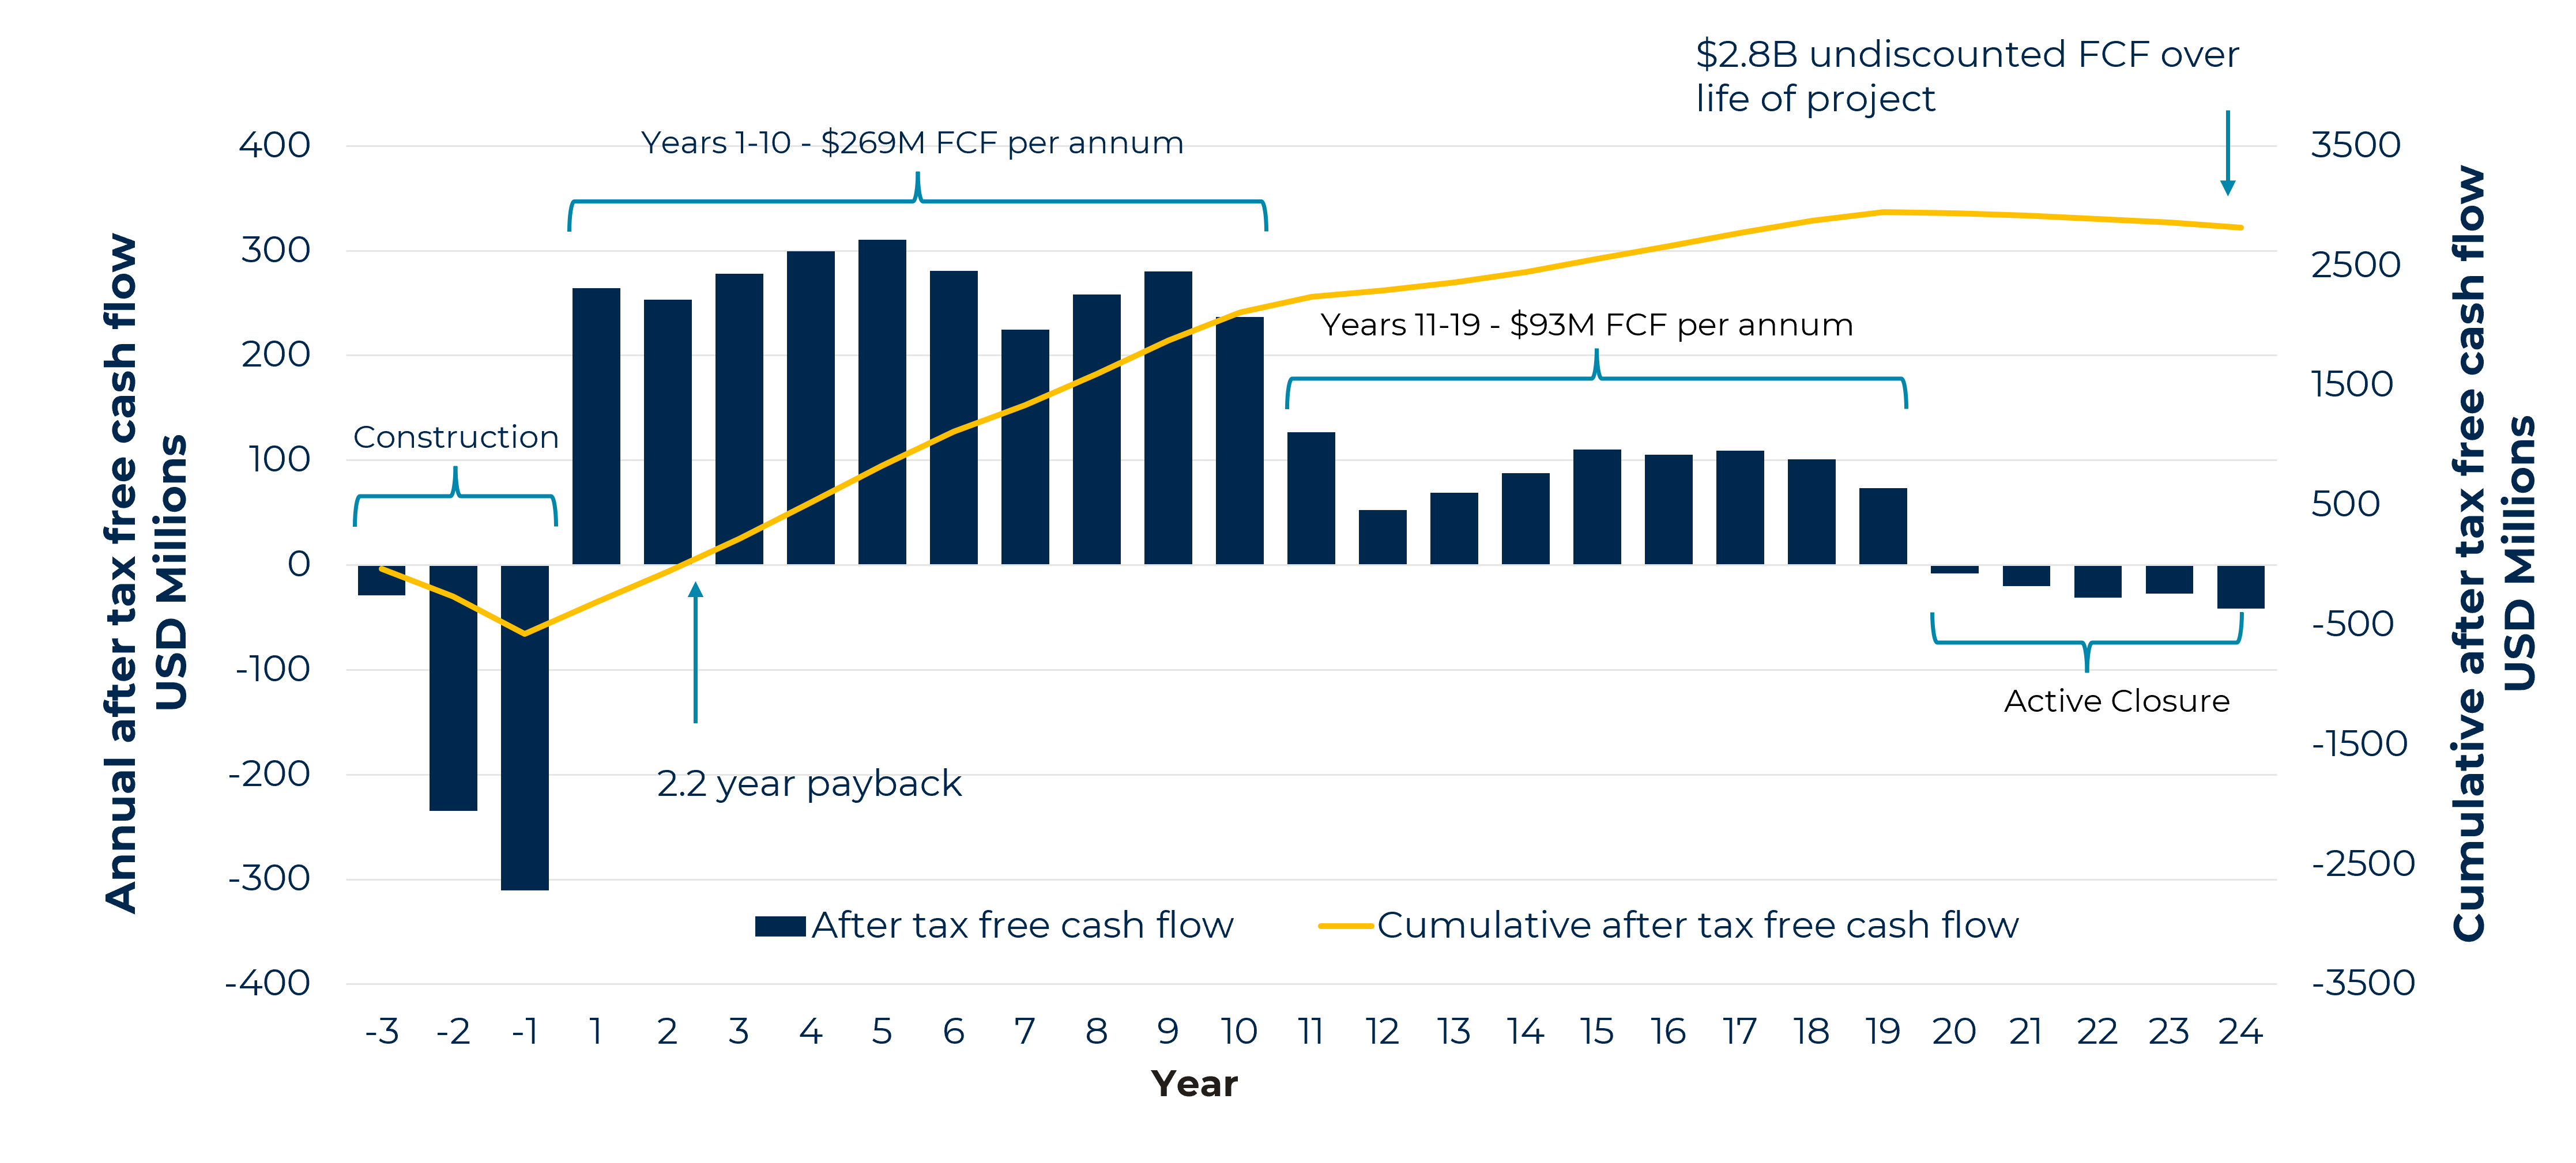
After-tax Net Present Value (5% discount) (“NPV”) of $1.7 billion with unlevered Internal Rate of Return (“IRR”) of 38% and payback after 2.2 years, assuming long term market consensus gold price of $2,150 per troy ounce (“oz”). NPV of $2.5 billion with IRR of 49% and 1.7 year payback at $2,650/oz.
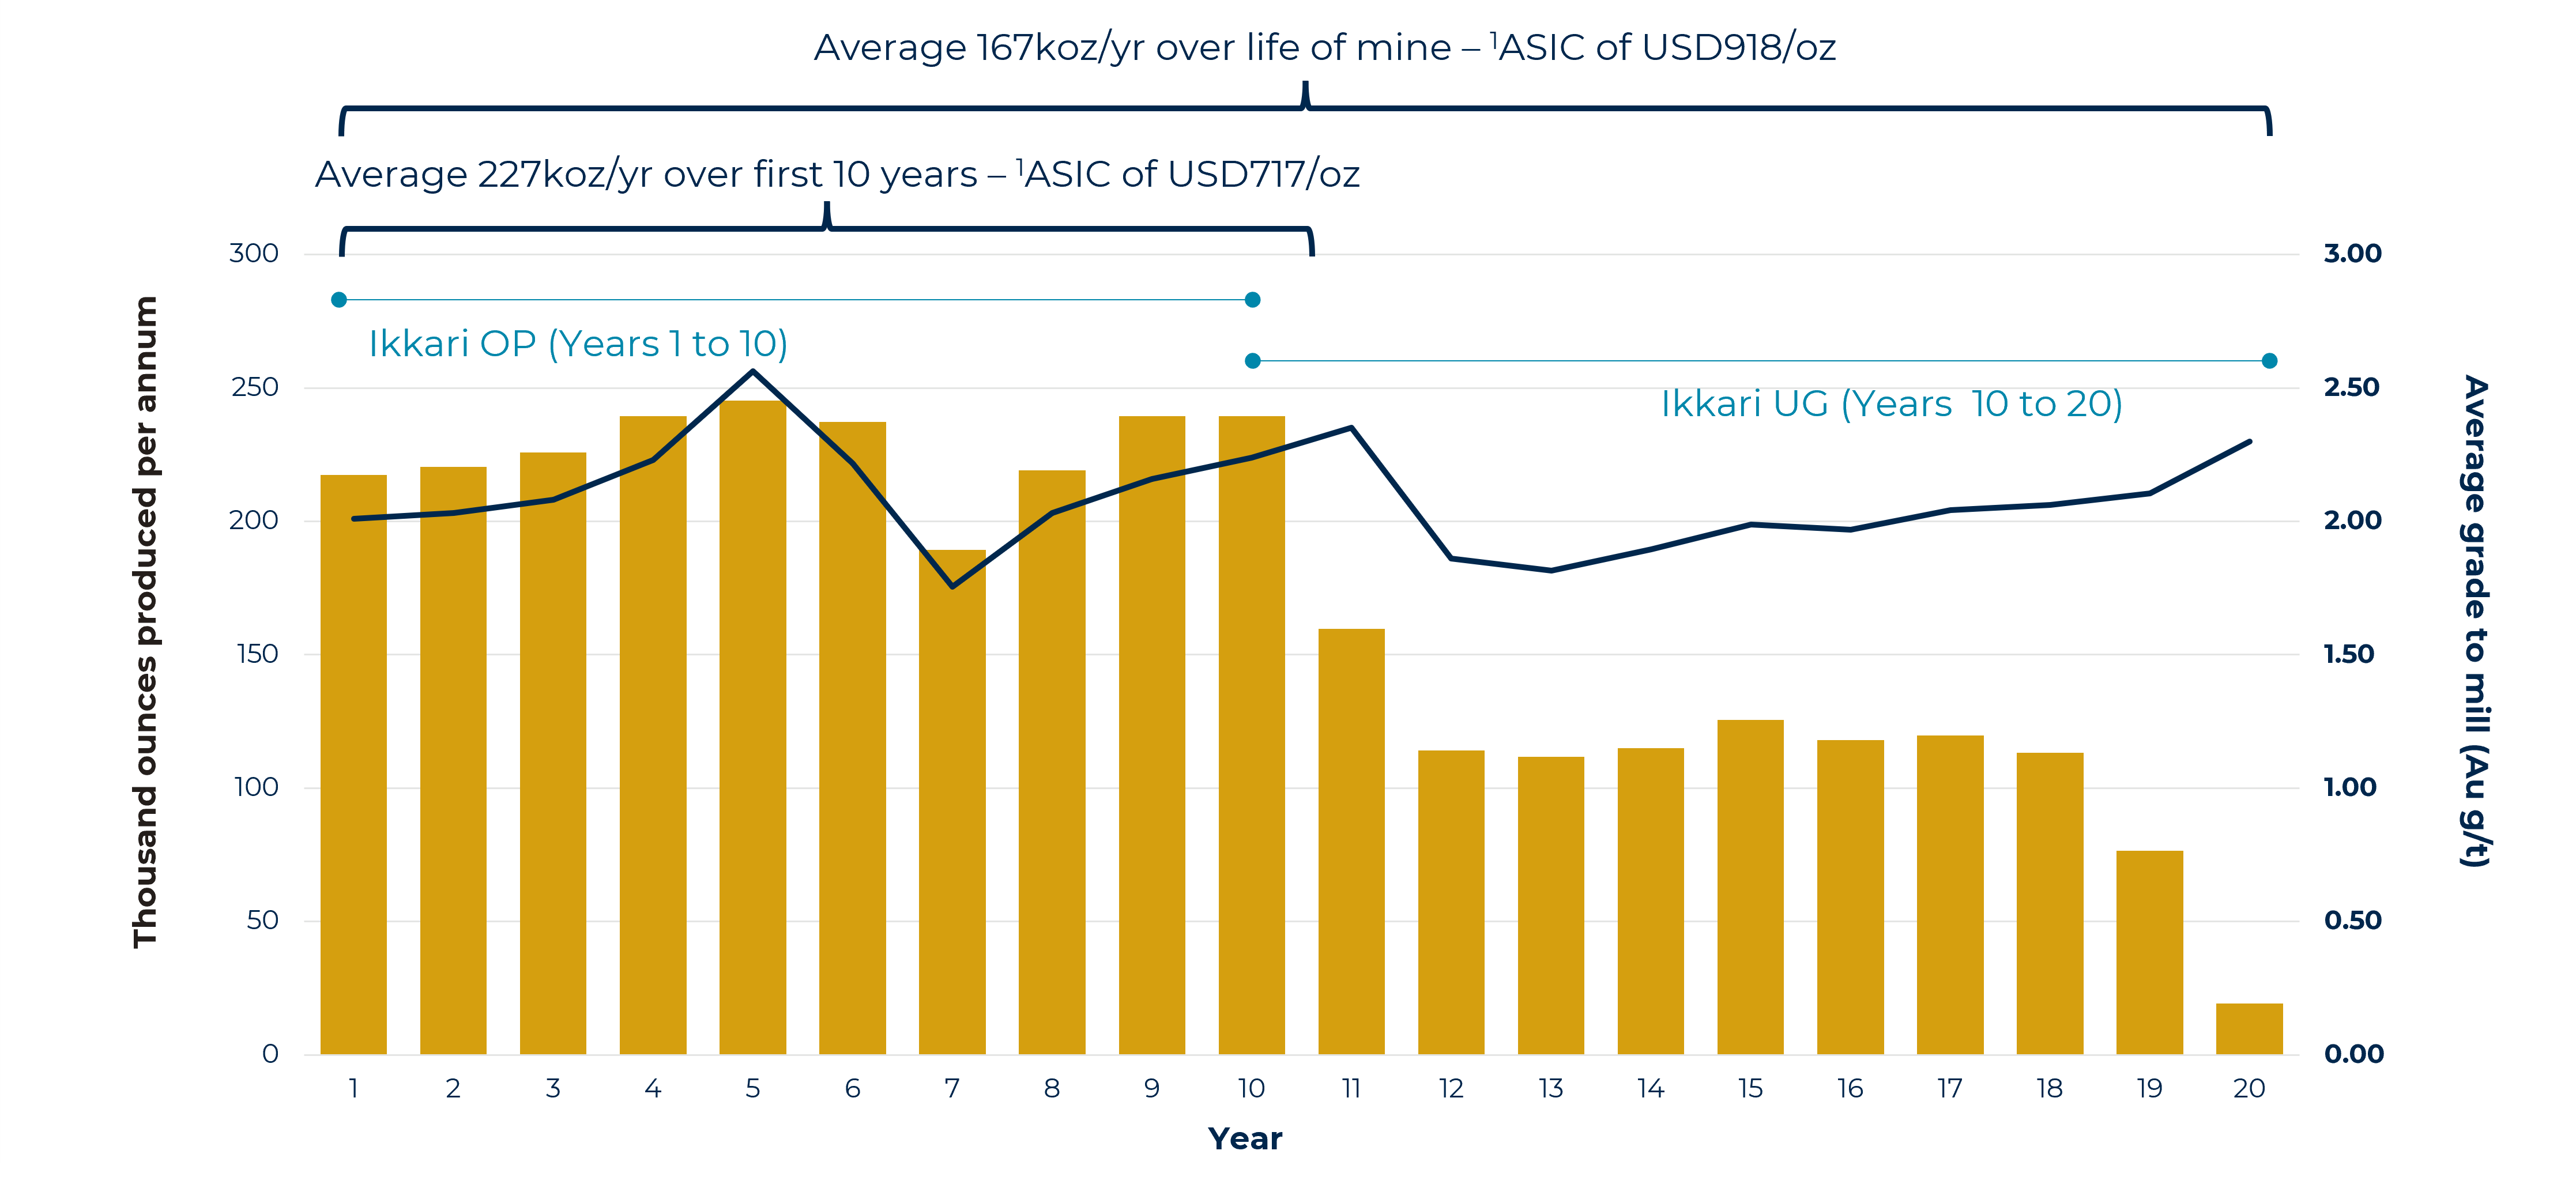
Expected lowest quartile all-in sustaining cost (“AISC”) of $918/oz over LOM, and $717/oz during years 1 to 10 primarily due to a high open pit grade and low strip ratio.
Long life: 20-year life of mine (“LOM”) comprising an open-pit operation for the first 10 years with average annual production of 227koz per annum, transitioning to an underground operation (years 10 - 20).
Manageable initial capital requirement of $575 million including contingency with project maintaining the low capital intensity indicated by the 2022 Preliminary Economic Assessment (“PEA”).
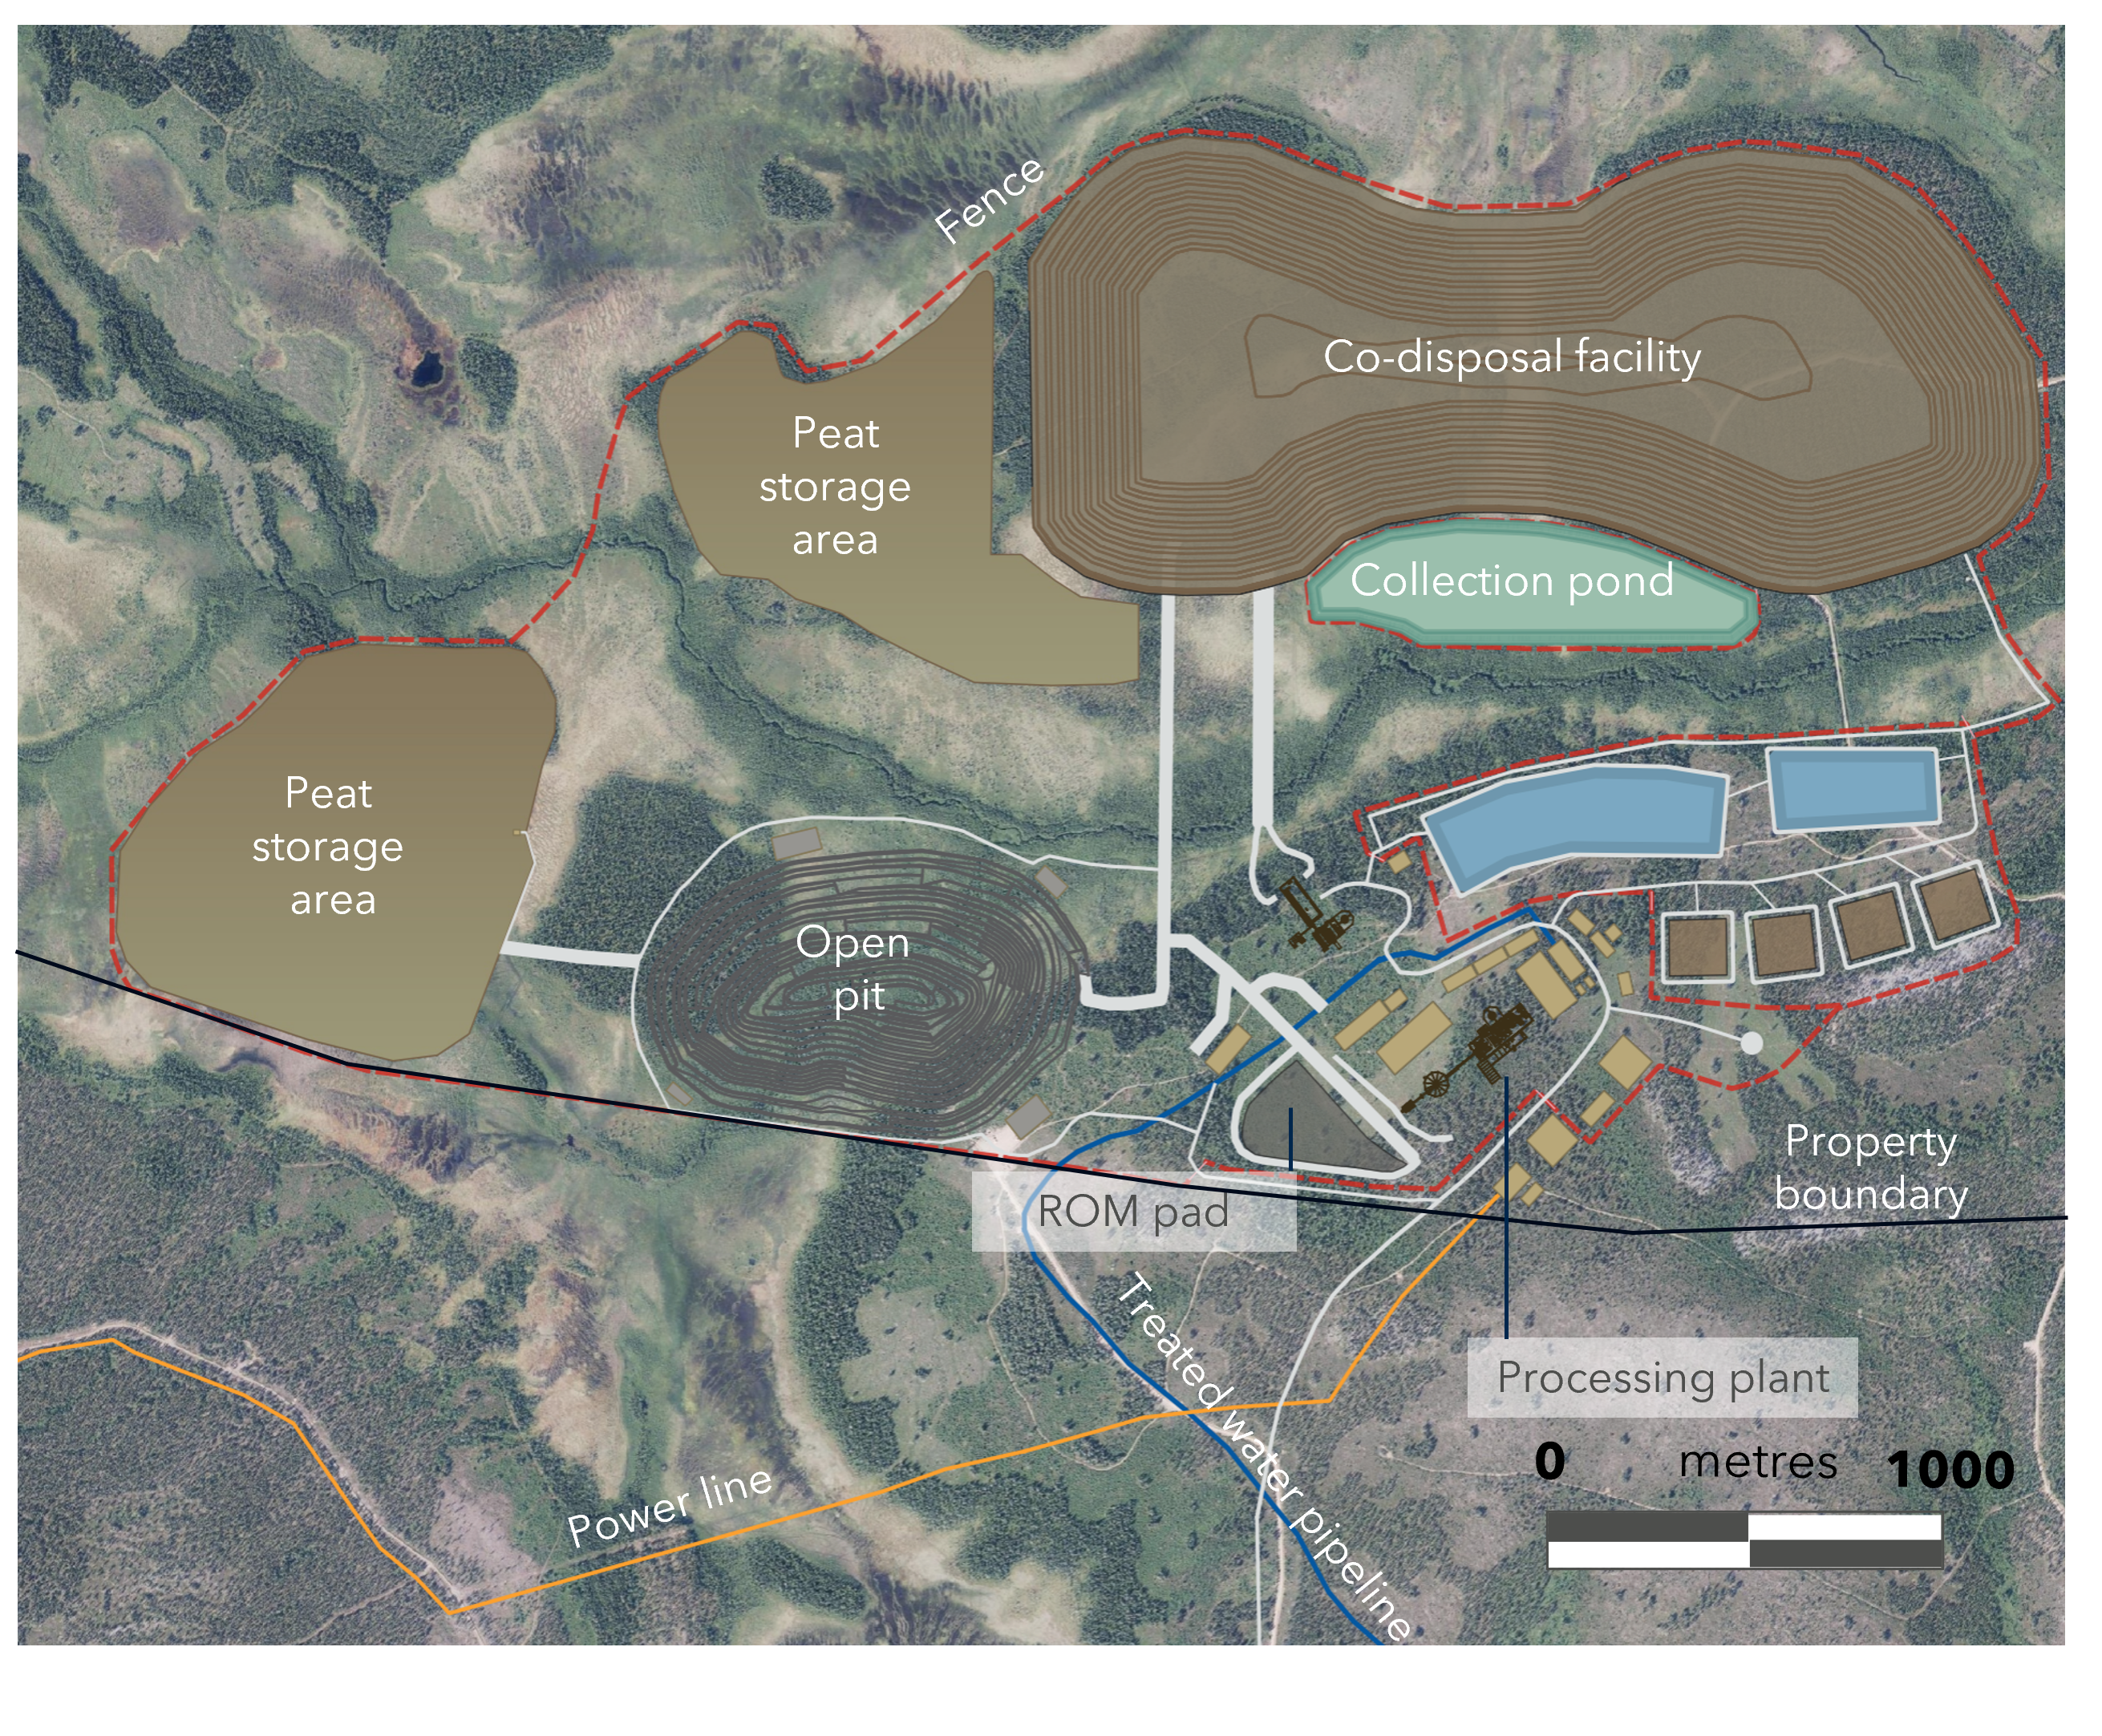
100% Contained within Rupert Property: All project infrastructure contained within Rupert’s 100% owned exploration licences. Access road, power line and discharge pipeline permitted though separate auxiliary permitting process and do not require siting on mining or exploration permits held by Rupert Resources.
First gold pour targeted in 2030 based on Environmental Impact Assessment (“EIA”) submission and Definitive Feasibility Study (“DFS”) initiation in H2 2025, a 24-month permitting timeline and a 2½ year construction period.
The Ikkari PFS envisages a staged mine design to minimise waste stripping and enable early production from high grade areas in the open pit. The open pit will produce ore for 10 years before transitioning to a long hole open stope (“LHOS”) underground mine from year 10 for the remainder of the 20-year LOM. Both the grade and the low strip ratio in the open pit are key drivers of a lowest quartile ASIC operation set out in the PFS. An expected lowest quartile all-in sustaining cost (“AISC”) of $759/oz is outlined over LOM, and $717/oz during the first ten years.
To provide the best experiences, we use technologies like cookies to store and/or access device information. Consenting to these technologies will allow us to process data such as browsing behaviour or unique IDs on this site. Not consenting or withdrawing consent, may adversely affect certain features and functions.
Functional
Always active
The technical storage or access is strictly necessary for the legitimate purpose of enabling the use of a specific service explicitly requested by the subscriber or user, or for the sole purpose of carrying out the transmission of a communication over an electronic communications network.
Preferences
The technical storage or access is necessary for the legitimate purpose of storing preferences that are not requested by the subscriber or user.
Statistics
The technical storage or access that is used exclusively for statistical purposes.The technical storage or access that is used exclusively for anonymous statistical purposes. Without a subpoena, voluntary compliance on the part of your Internet Service Provider, or additional records from a third party, information stored or retrieved for this purpose alone cannot usually be used to identify you.
Marketing
The technical storage or access is required to create user profiles to send advertising, or to track the user on a website or across several websites for similar marketing purposes.